
The role of tables in SAP is quite serious and I've composed a small (almost) turn-key report that describes tables in the classic table notation - like so: MARA(MANDT, MATNR, FIELD1, FIELD2, ...). I'm sure you're system is documented fine. Auto-documentation can be a great help nevertheless.
Document your system - table definitions
Here's how it works: say you have a system with 80 Z-tables, you can run the report and output will be composed in the format you may well remember from the Software Engineering books. The table name, followed by a listing of key fields (underlined) and normal fields, in the sequence they can be found on the table. As this setup requires underlining output, and involving a Smartform is a bit cumbersome, output in HTML was used.
The report will gather it's information and output the results in HTML format, which will look something like this:
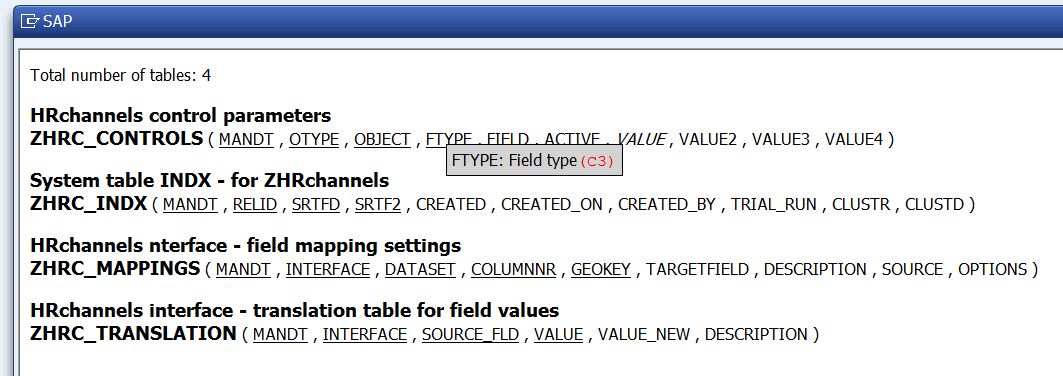
The strength in this style of documenting is it's simplicity. Even though the relations between tables isn't shown, it reveals a lot of information about the tables in a very compact manner. Of course, I've added a few features, like counting tables and fields. The simplicity is not lost though... I hope..
- Z-tables - the default setting on the selection screen is for all tables starting with a
Z, but the setup works for SAP's standard tables just as well. - Foreign keys - if a field is a key field in (at least) one of the other tables - in the selection - it is shown in Italics. Foreign keys are key fields, but not in the table they are listed on.
- Descriptions - fields are identified by their field name, a compact and unique code. Hover over the field with your mouse and a small popup will appear showing the field description.
- Field types - a brief version of the field type definition is shown when hovering over a field,
C10would be a character field length 10. - When table maintenance is generared for the table, it can be edited through
SM31. The overview shows which tables can be edited. - Note that the document is shown in the system's default browser - which is Internet Explorer in most cases. Press ctrl-F for a "Find" window, which will highlight the results. You can also press the right mouse button and store the document content to an .html file, which can be used elsewhere. The hovering-functionality will be incorporated in the .html file.
Wait ! There's more...
If you are looking into the tables on your system, the question that may be relevant is "what tables are select/changed/deleted by a given report" ? The selection screen allows selection of table names - defaulted to Z*, but you can also supply a report name of a main report. The documenter will find all select statements, inserts statments and so on, and compose the documenter table selection with this. Thus:
- All involved tables for a report (or module pool) are shown
- For every table, the overview will show the actual usage, thus
1x INSERT 12x SELECT
Really - you should try this out. Especially when you are dealing with reports that were build by others or some time ago.
HTML report output ?
This downloadable copy doubles as an HTML report generator example. If it's SAP data you want to process in a fancy colorful way, and you know your way around HTML, the setup described here can be a useful example. The HTML content includes style information and even 2 javascript functions that reveal additional field information when hovering over a field. The field description information is made available on the HTML file as JSON data.
Download your own copy here

Do note: you will need to create a Dynpro for this report, which contains a Custom container with the name HTML, and it will also need a PBO and PAI module in the Dynpro flow logic. Alternatively, you can download the Dynpro here, and import onto your report with SE51 - Screen painter.