

To prepare an upgrade it is good to know what we are dealing with. SAP has done it's share in upgrading their part and we have been utilizing the system with our own coding. But exactly how much coding is that ? What if all coding lines in reports, includes, function modules and even classes are added up ? Is it possible to get an overview ? With a free download report it is...
The technique is simple: all custom build programs are in Y* or Z* naming conventions and with a bit of added logic all programs and includes (including function groups and function modules - which also reside in an include) are listed. Classes with methods are also added to the equation. But only when they are assigned to a development class which can be transported (thus $TMP objects stay out of sight).
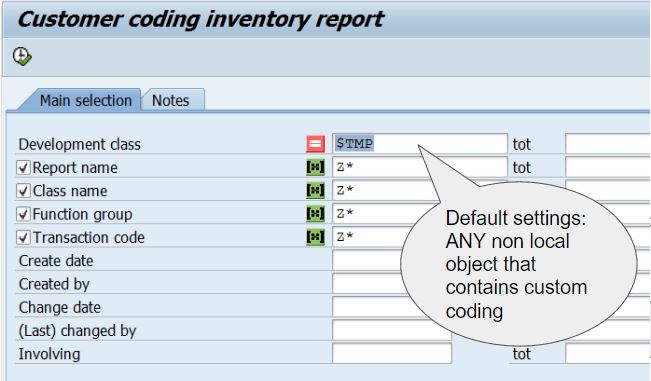
The report selection screen caters for the main parameters of this report. Normally the startup screen is left as-is, but then you may want to use it to measure growth in a certain area (a package) or focus on a group of HR reports (which have a ZHR naming convention).
So what will this report reveal ? The output is an ALV with SAP technical objects that involve coding. The type, creator, creation date, changer and last changed date is listed, along with the number of lines of coding involved. An example of the output:
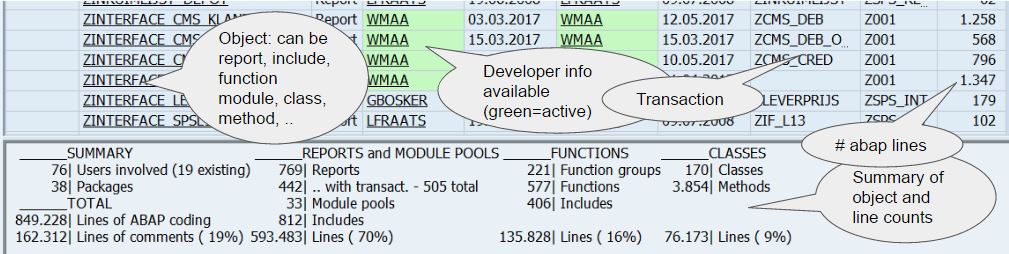
This overview reveals:
- There are just under 850.000 lines of custom Abap coding in this system (bottom left)
- The total number of user-ID's that either created or changed custom technical objects is 79, of which 19 are still active
- Of the 769 reports, only 442 have a transaction code
- the list goes on and on...
If you would like to know which developer contributed most to developing the system, just play around with the Nr. of lines column as aggregation field and the object type field (report, include, ...). Thus: (1) select the Nr. of lines column and set it as aggregation field (the E - totals Icon), then (2) select the object type column and mark it as aggregation level (the icon that is only available if at least one totals field is assigned), then (3) click on the graphical display icon. This could show something like this:
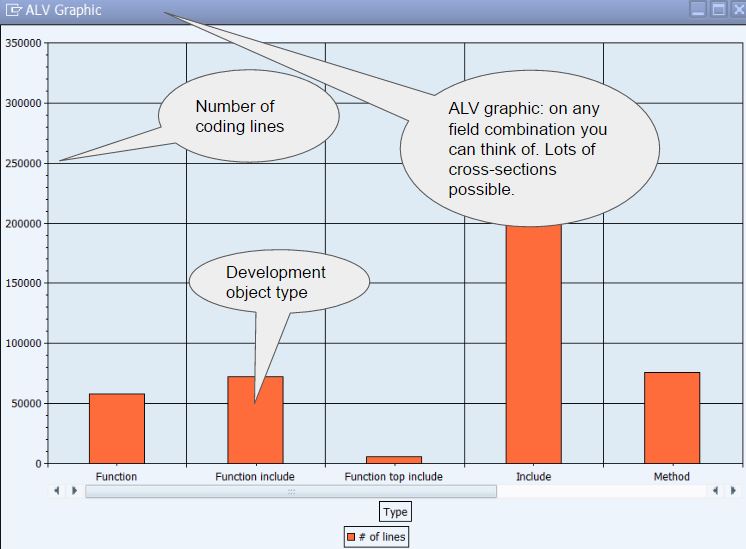
To the trained eye this reveals that there are about 75000 lines of coding in the system's Function module includes.
Using notes
When using this report in an actual upgrade, I found the ability to add a simple note and maybe a description very handy. Reports or technical objects that had been replaced by other objects could be marked as "IGNORE" and the current version (version that is currently in use) can be set to "IN FOCUS" or whichever coding you like to use as Node ID.
The node ID, a 45 character text, another 45 character text, create date and creator, change date and changer can all be made available in the ALV listing. The node-related cells are all coloured, so they stand out between the technical details columns.
What's more to explore ?
This report can be used to get a grip on the system, which is explained easiest by example:
Effective lines
The number of effective coding lines is calculated/determined as follows: the total number of lines includes empty lines as well as comment lines. Even though both serve a purpose and should not be ignored, it's also good to know there is an effective code line counter available as "Effective lines".
Note that for each development component the number of comment lines and the number of empty lines is available in the ALV report, as hidden columns. Thus it's easy to spot the coding blocks that have a lot of comments (have effectively been disabled) or contain a lot of "air" (many empty lines).
Comments
Abap coding should have a healthy set of comment lines, to explain the setup. In function modules, comment lines for the interface parameters are added automatically, so comments should be available. But what if whole source code blocks are commented out ? The system sizer report reveals the number of comment lines and/or the percentage of the coding that is in fact comment lines. It can help identify disabled coding.
What's been done by ...
Specify a user ID in the "Involving" field and the report will show all objects/sources which were either created by, changed by or both - the specified user ID. If you know who was involved in a development, but you don't know the name of the report or module, simply run the report with "Involving".
The package
By default, the report specifies the exclusion of the $TMP package, as temporary sources are not deemed very relevant. If it's 3rd party software you need to know more about, it's good to know this: the package name is a very effective way developments are grouped, thus showing only the components from a 3rd party or excluding the components of that 3rd party can easily be arranged. Just specify the package in the Development class field (Package = development class).
You can also run the report for development class $TMP, which would reveal the components that are not ready to be transported.
The biggest fish
Would you like to know what the biggest fish in the Abap pond is - on your system ? Simply sort the column with the line count in reverse order. Big is beautiful ? In Abap I have to disagree.
Big days - for the system
With the creation date of components, there is something else you can visualize with this report: at some point third party software could have been installed, which effectively means a lot of coding is dropped into the system on a given day. Set the line counter column as aggergate and create sub-totals per creation date. Then display the information as a graph. Big days show as big bars.
Try it for yourselves !

Sharing key figures
The key figures that are effectively a "fingerprint" of your system, can also be compared to other systems, There are 2 functions available through the report command box (there are no menu items or buttons available for this - unless you add them yourselves). Command COPY will copy the settings into the windows clipboard, from which you can place them in your own file. Before doing this, a popup is displayed in which you can fill in the company name and comments, both optional. The report will then open an ALV report with the main settings/counters. If you use PASTE in the command box, the report will try to interpret the settings from the clipboard and list the results in an ALV. I've gathered some settings from the system's I have worked on which can be used as a reference or example output. Fictional data of course.
More on notes
The notes are stored in table HLPINDX which is available in standard SAP. The 2nd tab on the selection screen allows downloading and uploading the information on the table, so the setup can be moved through the system landscape and settings can also be moved. In fact, there are 6 areas which can be filled in and held on the system independently. The download/upload functionality is embedded in the report, accessible through the 2nd tab on the selection screen.