
A method to visualize the life of a development (program). If you would like to check what happened to a given (customer) development since it was created, an ABAP report gathers transport details along with the program's size (counting the number of lines). The size is used as a complexity-barometer and it's interesting to see how many changes have been applied, how much time between changes and whether (and how much) the complexity grows (or decreases).
The report lists the full history of development objects involved. Transports that have been created within 7 days of the previous transport, are regarded as "part of a development round", for which the rounds counter is shown. The transport number and the object name (a report or include) can be clicked on. This setup works for reports and module pools, where all involved (custom) includes are selected. An impression:
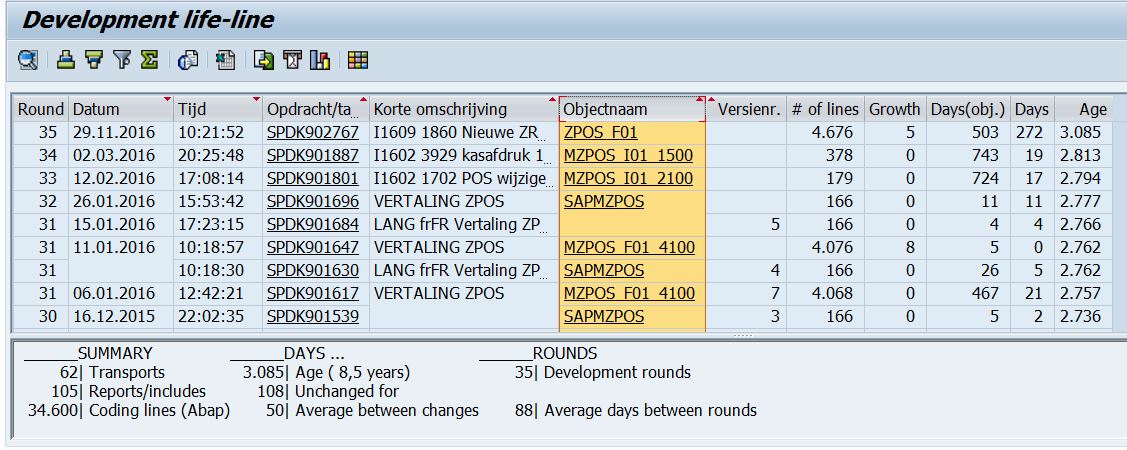
From the overview the change history is visualized. For each object involved, the size (nr of lines of Abap coding) is retrieved (for that version) so the actual growth is also shown. Let the report show you what happened to your development.
 .
.